Another beautiful day of racing for today's Stage 8 of the Tour de France! It was also a beautiful day for the nation of France. The first to reach the peak of the category-4 climb at Col du Mont Bel-Air with 82 km (51 km) left was Frenchman Romain Sicard (click on the image for a larger view).
Though André Greipel powered his way to fifth place in the intermediate sprint (click on the image below for a larger view), picking up 11 points in doing so, it was French cyclist Pierre-Luc Périchon who was first out of the breakaway group to win the sprint and earn 20 points.
France continued to showcase its lovely countryside. The Tour de France is a fabulous boon for tourism! I grabbed the screen capture below with about 78 km (48 mi) left (click on the image for a larger view).
This scene is near Moncontour and you can just see the sea in the distance. Could the peloton have enjoyed a better day?
Of course the big winner for France today was native son Alexis Vuillermoz, who blew away his competition inside the final kilometer of the category-3 climb in Mûr-de-Bretagne. Speeds got up to about 72 kph (45 mph) with about 5 km (3 mi) left as teams tried to prepare their big sprinters. But it was Vuillermoz who got it done. Does he look happy crossing the finish line (click on the image for a larger view)?
Chris Froome retains the yellow jersey, but it was a splendid day for France. Below is the comparison between reality and our prediction.
We are thrilled with an error under half a percent! Check out Vuillermoz's average speed below.
Stage 8: 11.59 m/s (41.74 kph or 25.93 mph)
Tomorrow's Stage 9 is a team time trial that begins in the commune of Vannes and heads 28 km (17 mi) almost due north to the commune of Plumelec. Below is our prediction.
Stage 9: 31' 50" (prediction)
It will be interesting to see which teams compete well for the best time. A lot of strategy goes into the team time trial. Riders take turns in the lead so teammates can save energy through drafting. The 2013 Tour de France saw Orica-GreenEDGE set the record with an average speed of 57.84 kph (35.94 mph). Click here for my post on that stage. If speeds are that fast tomorrow, our prediction will be a bit slow!
Mark Cavendish exploded in the final few meters and pushed just ahead of André Greipel to win his 26th career Tour de France stage. Wow, what a great sprint to finish off Stage 7! Below is my screen capture just as the Manx Missile crossed the finish line (click on the image for a larger view).
Racing was faster today in the gorgeous French countryside. Temperatures were warm, around 27 C (81 F), and scenery was beautiful. I grabbed the screen capture below with 102.5 km (63.7 mi) left (click on the image for a larger view).
That is just one of many lovely bucolic vistas the peloton could behold (through the trees!). I also enjoyed seeing Daniel Teklehaimanot of Eritrea making Africa proud as that continent's first person to don the polka dot jersey. I grabbed the image below with 91.5 km (56.9 mi) left (click on the image for a larger view).
Below is a comparison between today's reality and our comparison.
After the past three stages, I'm thrilled to be under 2% today! The average speed for the Manx Missile is given below.
Stage 7: 11.87 m/s (42.74 kph or 26.56 mph)
Now that's more like it! The racing in the final 20 km (12 mi) was wonderful, and the last sprint with the world's best sprinters was exhilarating.
It's a great day for Great Britain with Mark Cavendish of the Isle of Man winning the stage and Chris Froome of Team Sky reclaiming the yellow jersey after Tony Martin broke his collarbone yesterday and had to withdraw from the Tour de France.
Cyclists contend with a 181.5-km (112.8-mi) medium-mountain stage tomorrow that commences in the French city of Rennes. A category-4 climb awaits riders halfway in, and a category-3 climb ends the stage at the commune of Mûr-de-Bretagne. The finish is essentially due west of the start, but cyclists will have plenty of twists and turns as they compete in the last stage before Sunday's team time trial. Below is our prediction.
Stage 8: 4h 19' 45" (prediction)
I hope the weather tomorrow is as perfect as it was today. Enjoy the final climb. It will whet your appetite for the real climbs to come!
Unlike yesterday's stage, today's stage was fought for in the most gorgeous of weather. The scenery was so amazing that I scrawled a note to myself: bike some of those roads someday! With about 115 km (71.5 mi) left in the stage, I grabbed this screen capture of the peloton (click on the image for a larger view).
Does that look wonderful or what? With about 90 km (56 mi) to go, I grabbed this image of the peloton (click on the image for a larger view).
That road would be so much fun to bike! I love the windmills (I wish my country utilized wind power more!). Helicopters kept flying by the Alabaster Coast, so I grabbed the screen capture below (click on the image for a larger view).
I've been atop the white cliffs of Dover before, and I've walked the beaches of Normandy, but I've never been up close to the Alabaster Coast. Something new for the "to visit" list!
During the 2013 Tour de France, our model came in quite slow on several stages. That year saw speeds that were unheard of in the past. There were even whispers about nefarious means of achieving those speeds. The pace this year has been in the other direction. I knew we would be too fast yesterday because of the terrible weather. When today's stage began, and the weather looked impeccable, I thought we had a real shot at a great prediction. There were three breakaway cyclists and the peloton looked strong. But as each hour went by, it became apparent that we were going to be much too fast again. Instead of speeds being above 40 kph (25 mph), they were considerably below that speed. I kept wondering when the peloton was going to kick it up a notch. I obviously can't get inside the riders' heads, but it seemed at times as if they were simply enjoying the breeze and scenery. And who could blame them!
Only in the last 20 km (12 mi) or so did cyclists really crank it up, sometimes reaching speeds as great as 62 kph (38.5 mph). An unfortunate crash happened with only about 900 m (0.56 mi) left (click on the image for a larger view).
Last year's winner, Vincenzo Nibali, and current yellow-jersey wearer, Tony Martin, were among those involved. The crashed marred the final sprint, won by Czech cyclist Zdeněk Štybar. Below is a comparison between reality and our prediction.
Štybar was ecstatic when he was the first to cross the finish line (click on the image for a larger view).
When Ben Hannas and I began modeling the Tour de France in 2003, we were thrilled to be under 10% on any given stage. But as the years went by and our improved models hit stages much better than 10%, I got annoyed when our predictions came close to 10% of reality. What would have made me happy a dozen years ago bothers me today. Our prediction wasn't that good! I don't know why speeds weren't greater on such a perfect-weather day. The riders certainly know what they are doing, and they are employing strategies better than anything I could formulate. Below is today's winner's average speed.
Stage 6: 10.86 m/s (39.11 kph or 24.30 mph)
Despite three short category-4 climbs today, that average speed is closer to a fast stage in the mountains! It's 4% slower than yesterday's average speed, and yesterday's stage, essentially the same length as today's stage, had all the rain and crosswinds. Even the time schedule on the Tour de France web site thought the average speed today would be in the range 41 kph (25.5 mph) -- 45 kph (28.0 mph). Teams' strategies obviously called for a slower pace today. Tomorrow's Stage 7 picks up in the commune of Livarot and takes cyclists 190.5 km (118.4 mi) southwest to the commune of Fougères. It's a flat stage about the same length as the previous two, and has just one category-4 climb near the start. Below is our prediction.
Stage 7: 4h 32' 22" (prediction)
Perhaps it's because this year's Tour de France has such a stark split between early flat stages and late mountain stages that cyclists are holding back a little right now. I don't like our predictions being so off, but it's a lot of fun trying to figure out why!
Modeling the Tour de France is for me as much fun as watching it. Using the laws of physics, real-world models for cyclists and their equipment, and models for complicated terrain, I feel like a giddy kid (a MUST feeling for a scientist!) when we hit stages within a few percent. There are, however, stages for which I know our predictions won't be great. Northern France and its weather have hit us pretty hard in past few years, leading to prediction errors around 7% - 8%. That happened again today, and I knew it from the moment the race started. Below are some screen captures I put together into a single image (click on the image for a larger view).
The above images came after an early crash. You'll see flags in the first image revealing treacherous crosswinds that reached 35 kph (22 mph). The bottom image shows Teams Sky and BMC getting pelted with rain. Weather made racing so bad that there were no chase cyclists; teams simply stayed bunched together. Crosswinds and rain were responsible for splitting the peloton in two, and for the big crash, shown below, that happened with about 25 km (16 mi) left in the stage (click on the image for a larger view).
Knowing that we were going to be too fast, I was hoping for a great sprint into Amiens, but riders had to contend with a 25-kph (15.5-mph) headwind, as shown below (click on the image for a larger view).
I grabbed that screen capture with about 10.4 km (6.46 mi) left. Look at that French flag!
The last kilometer did provide a fantastic sprint. Because the bad weather meant no one could break away until very close to the finish, all the best sprinters were vying for the win. André Greipel prevailed and got his second stage win of this year's Tour de France (click on the image for a larger view).
Below is a comparison between the actual winning time and our prediction.
I can live with a 7% error, given today's weather, and the error is in the right direction. It's not an excuse to note that we can't predict the weather. Greipel's average speed is given below.
Stage 5: 11.32 m/s (40.75 kph or 25.32 mph)
For all the bad weather, today's stage did get viewers to think a bit about the past. Riding through areas where fierce and bloody fighting took place during World War I, including the Battle of the Somme, cyclists passed several memorials and cemeteries. Seeing so many graves of so many heroes was truly sobering. That riders from countries at war with each a century ago are shoulder to shoulder in a bicycle race is wonderful. It's too bad there are places in the world today where groups are killing and oppressing people. Let's hope events like the Tour de France continue to soften hearts against hatred of people different from ourselves. Stage 6 begins in the commune of Abbeville and takes riders 191.5 km (119.0 mi) southwest along France's northern coast to Le Havre. Our prediction for the flat stage is given below.
Stage 6: 4h 24' 45" (prediction)
If weather off the English Channel does to tomorrow's stage what it did today, we'll once again be too fast. I'm hoping for great weather and fast racing!
German Tony Martin, known for his time-trial dominance, exploded out of the leading group with about 3.4 km (2.1 mi) left and powered his way to victory. I tried to grab the screen capture when Martin made his move, but he was too quick for me! The image below shows Martin leaving his competition in his dust. Martin is at the top of the image (click on the image for a larger view).
Martin couldn't be caught as he zoomed through the streets of Cambrai. Look how happy he is crossing the finish line (click on the image for a larger view).
Because of all the cobblestone sections, and because today's stage is the longest of this year's Tour de France, modeling is challenging. Riders seemed a bit slow, timid, and, at times, nervous through the first half of the stage. I kept waiting for the speeds to pick up, but they never did. We were clearly thinking the pace would be faster before the cobblestones were reached. Below is how our prediction fared.
We thought the first half of the race was going to be at a faster pace, but the riders held back a little and gave us a wonderfully exciting finish.
There were many great scenes to behold in the stage. Below is Rigoberto Urán tucking a banana behind him with about 97 km (60 mi) left (click on the image for a larger view).
I love how skilled those guys are at eating and drinking while flying on a bicycle. When the peloton entered Goegnies-Chaussée, moving the Tour de France from Belgium to France, I grabbed the screen capture below (click on the image for a larger view).
Of course the cobblestones were the main attraction on the route today. Below is a screen capture from the first section in France, a bit more than 45 km (28 mi) from the finish (click on the image for a larger view).
Lots of dust on those cobblestone roads! Rain also hit riders a few times, slowing the pace a little and probably responsible for a couple of crashes.
Another flat stage is on tap for tomorrow. Commencing in Arras, the 189.5-km (117.7-mi) stage takes riders southwest, to Amiens. Our prediction is below.
Stage 5: 4h 19' 08" (prediction)
Fast winds pervaded early stages in northern France last year. Let's hope the weather is superb and racing is fast tomorrow!
The weather in Belgium was great for today's Stage 3. The rain and high winds of yesterday were nowhere to be seen today. I grabbed the screen capture below when the peloton was about 107 km (66.5 mi) from the finish (click on the image for a larger view).
Isn't that Belgian countryside beautiful?!? The gorgeous weather belied what was to come. With so many riders in the peloton, racing conditions became dangerous on narrow roads. Two huge crashes occurred with cyclists moving slightly downhill at about 45 kph (28 mph). I grabbed the screen capture below just as the crash happened that clobbered Fabian Cancellara, who donned the yellow jersey at the time (click on the image for a larger view).
Sadly for Cancellara, the crash greatly affected his day and dropped him all the way to 109th overall. Four riders were knocked out of the race, including Tom Dumoulin, an exciting young German cyclist who entered today's stage third overall.
The race had to be stopped at one point and suffered more than 20 minutes of neutralized racing. The image below shows the riders stopped at the foot of Côte de Bohissau (click on the image for a larger view).
The race was then neutralized until the riders made it to the top of Côte de Bohissau. To give you an idea of how brutal the crashes were, I grabbed the screen capture below, which shows Greg Henderson with a torn jersey (click on the image for a larger view).
The cyclists who endured the crash and managed to finish the stage certainly earned my respect. Not only are they great athletes, they are tough as nails. Once racing began again, riders were timid as they needed to warm back up. Some were injured and some had damaged bikes. When all the cobwebs were shaken, cyclists were flying, reaching speeds around 55 kph (34 mph). The final climb was great to watch as riders jockeyed for position. The screen capture below shows Joaquim Rodríguez of Spain crossing the finish line just ahead of Chris Froome, who now has the yellow jersey (click on the image for a larger view).
We had a great prediction today, though I feel a bit depressed because crashes had to stop time and talented cyclists had their day ruined. Below shows how we did.
We love it when our predictions come in under 1%! Below is the winner's average speed.
Stage 3: 12.85 m/s (46.25 kph or 28.74 mph)
Tomorrow's flat stage is the longest of the race at 223.5 km (138.9 mi). What makes it even more challenging are seven sections of cobblestones totaling 13.3 km (8.26 mi), the longest at 3.7 km (2.3 mi). Beginning in the Belgian town of Seraing, the stage takes riders into France for the first time, ending in Cambrai. Below is our prediction.
Stage 4: 5h 04' 45" (prediction)
Let's hope that rain and winds don't mar tomorrow's stage like they did in last year's Stage 5, which also had cobblestones (click here for my post on that).
USA's women's team played the beautiful game beautifully in the 2015 Women's World Cup. When Carli Llyod achieved her hat trick in the 16th minute, it was all over. Japan fought valiantly, but the USA was too dominant. It was pure joy watching our women's team play so technically sound, play defense so splendidly, and attacked so ferociously. It was absolutely a team effort and a well-earned third World Cup win, more than any other country. I'm immensely proud of my national team. I had to grab a screen capture of the team with the trophy (click on the image below for a larger view).
German André Greipel, nicknamed the Gorilla, prevailed in a very close finish to win today's Stage 2. Rain and winds reaching 35 kph (9.72 m/s or 21.7 mph) pestered riders, as the image below shows, which is a screen capture I grabbed with about 56 km (35 mi) left in the stage (click on the image for a larger view).
Check out the screen capture I got below, which is the entry into Neeltje Jans (click on the image for a larger view).
The image below shows Greipel in red just ahead of Peter Sagan in the yellow helmet (click on the image for a larger view).
Sagan recovered beautifully after suffering a flat tire. Coming in third on the far left in the above image is Fabian Cancellara, who now has the yellow jersey. Mark Cavendish is on the far right in the above image, coming in fourth.
As I feared we might be after yesterday's record-setting speeds, we were a bit slow today with our prediction.
Our model's power output, based on last year's Tour de France, looks to be a tad low for this year's first two stages.
Tomorrow's 159.5-km (99.11-mi) medium-mountain stage begins in the Belgian city of Antwerp. Mostly flat to start, the stage contains three category-4 climbs and a category-3 climb at the finish on Mur de Huy, also in Belgium. We'll see how our medium-mountain power does; our prediction is below.
Stage 3: 3h 28' 35" (prediction)
I enjoyed watching the racing in the Netherlands. I can't wait to see Belgium tomorrow!
Australia's Rohan Dennis had the ride of his life today. In fact, he set the record for the greatest average speed in a Tour de France time trial. Check out Dennis navigating the streets of Utrecht after about 5 km (3.1 mi) of today's time trial (click on the image for a larger view).
Rohan Dennis flew around turns in the perfect Dutch weather. What an amazing record-setting ride! I grabbed a screen capture of Dennis as he powered his way to the finish line to become the only rider inside a quarter hour (click on the image for a larger view).
Dennis was an aerodynamic thing of beauty on his bicycle. Our prediction was much too slow, as seen below.
We're not happy with our first prediction, but it was hard not feeling anything but awe while watching today's first stage. Check out the winner's average speed below.
Stage 1: 15.40 m/s (55.45 kph or 34.45 mph)
I can't image going that fast on a bike, much less doing it for 15 minutes. Great ride, Rohan Dennis!
Tomorrow's 166-km (103-mi) flat stage picks up in Utrecht and heads southwest in the Netherlands to the artificial island of Neeltje Jans. Below is our prediction.
Stage 2: 3h 45' 51" (prediction)
If we are much too slow tomorrow, we'll have to rethink how much cyclists and their equipment have improved over last year.
The Tour de France opens with a 13.8-km (8.57-mile) individual time trial in Utrecht in the Netherlands. Let's hope the weather is great and racing is fast! There are 198 cyclists ready to go. Will a time-trail speedster like Tony Martin come out on top? We shall see. Below is our first prediction for this year's Tour de France.
Stage 1: 16' 38" (prediction)
We did well with most of the elite cyclists in last year's time trial, except Tony Martin was a bit faster than we thought. I hope everyone enjoys the first stage!
The 102nd Tour de France begins this Saturday in Utrecht in the Netherlands. Will Vincenzo Nibali repeat? Or will Alberto Contador or Chris Froome or someone else finish on top? This year's race looks mostly flat for the first half and mountainous for the second half. Watching the early strategies between sprinters and climbers will be lots of fun. My research student, Chad Hobson, and I are once again modeling the Tour de France. I'll be posting our stage-winning time predictions on this blog. We predict the winning time from a physical model of the race; we are not trying to model any particular cyclist. Sticking our necks out and putting predictions online ahead of the stages has made the physics research even more enjoyable. Look for our Stage 1 prediction tomorrow!
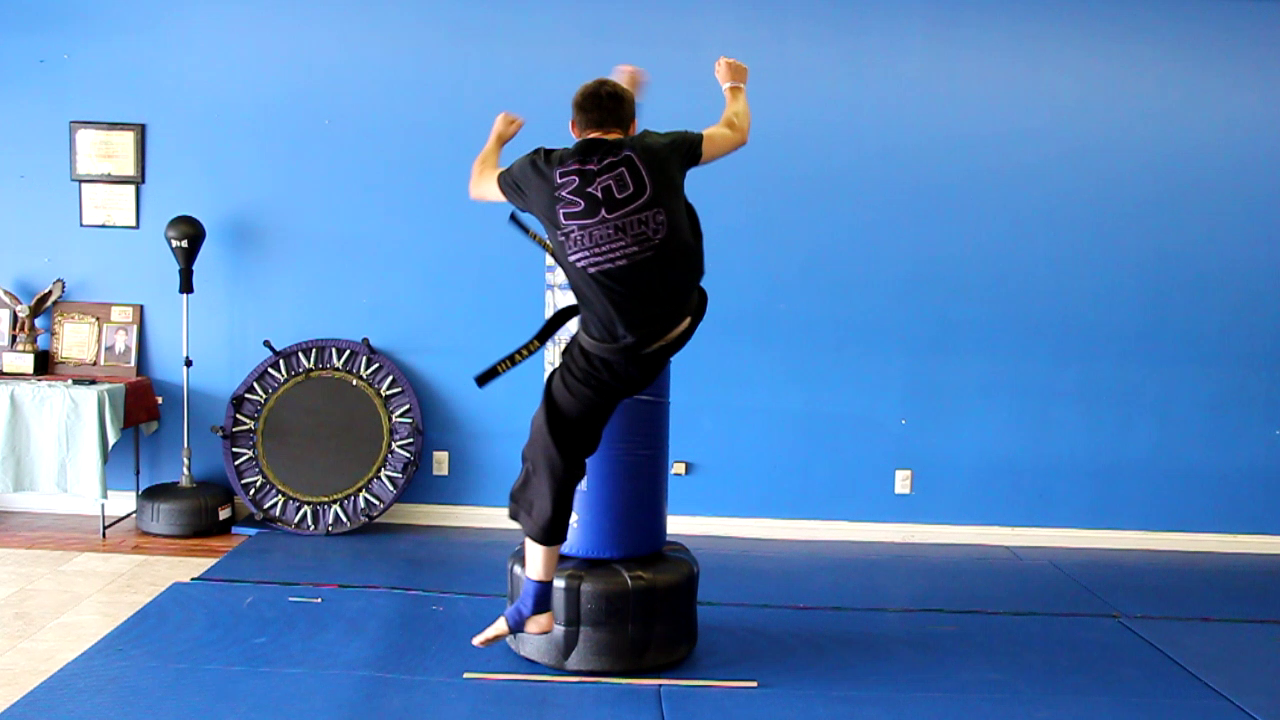
My last blog post came a fortnight ago. It focused on a flying side kick. For this post, I wish to look at one of my instructor's jump spin reverse crescent kicks. This particular kick is challenging for sure, but I love for it for all the physics goodies I can examine. Below is a video of Cody Davis of Super Kicks in Forest, Virginia showing how it's done.
Part of what makes this kick challenging is that one must jump from a guard position. Mr Davis began in a left-side guard and kicked with his right leg. There is no run up or step in to get a little extra "hop" before launching off the mat. As you'll note in the video, Mr Davis is able to kick higher than the padded target. The proof is in the image below (click on the image for a larger view).
The video below shows the same kick (on a different day), but this time filmed from behind.
It is on the back view that I wish to focus. Mr Davis launched himself off the mat with a speed of about 2.8 m/s (6.3 mph). His center of mass elevated 0.4 m (1.3 ft) at maximum height; he was off the mat for a time of 0.55 s. My goal now is to take you through that five-ninths of a second and show you just how much technique is involved in the kick.
The image below shows Mr Davis in a left-side guard, preparing to execute the jump spin reverse crescent kick (click on the image for a larger view).
From that position, he must "jump" and "spin." His back leg, i.e. his right leg, will deliver the blow. Because the imagined target will be hit with the outside of his right foot, we say that the "reverse" part of the foot, opposite the "crescent" side, is what hits the target. In the above image, what is about to do damage is farthest on Mr Davis' body from the target. The image below comes almost 0.4 s later (click on the image for a larger view).
Mr Davis has dropped his center of mass about 12 cm (4.7 in) in an effort to temporarily store energy. His body is now like a coiled spring. Energy is stored in his outstretched arms, bent legs, and bent back. That stored energy is needed to generate the necessary kinetic energy that's required to execute the kick. Just 0.28 s later, Mr Davis is in the configuration shown below (click on the image for a larger view).
More great physics here! Note how his arms are extended from his body. That is very important for what is about to happen. Think about an ice skater about to enter her final spin. Her arms, and mostly one leg, are extended fully before going into the spin. Look at the image below, 0.25 s later (click on the image for a larger view).
He has pulled his arms in closer to his body! That maneuver lowered his moment of inertia, and because he was up in the air with very little external torque, angular momentum conservation means that he spins faster than he did at the launch. His rotational speed in the above image is about 95 rpm, or about one-fifth that of a helicopter blade! Note, too, that his right leg is bent at about 90 degrees. Bad form on this type of kick is swinging a straight leg. The bent leg not only maintains a proper fold, it keeps moment of inertia down while large rotational speed is needed. Just 0.12 s later, we come to the money shot (click on the image for a larger view).
A jump spin reverse crescent kick is really a front kick at heart. Master that at the beginner's level and you're well on your way to being able to jazz it up. In the above image, Mr Davis has kicked his right leg forward and it makes contact with the imaged target with the outer part of his foot. By fully extending his right leg, moving his arms slightly outward, and having his left leg slightly off center, Mr Davis has lowered his moment of inertia considerably, which dropped his spin rate by more than half. The kick has been delivered and now Mr Davis must rotate another 90 degrees (click on the image for a larger view).
The above image is 0.13 s after the previous image. Note that Mr Davis has nearly refolded his right leg. That proper technique reduces moment of inertia, which gets him to turn faster. Think angular momentum conservation again! The "fold" and "refold" parts of a kick are not something karate instructors insist on for pedantic reasons. There is practical physics behind those exhortations! Now fast-forward 0.38 s to the image below (click on the image for a larger view).
Mr Davis has now landed and returned to his left-side guard. Compare that to the first one in this series and you'll see that Mr Davis turned 360 degrees.
It's certainly an impressive kick and one that takes years of practice to perfect. Buried inside the kick is a much simpler front kick. Master that first, then move on to the spin, and think about the physics!
Cody Davis is one of my talented karate instructors at Super Kicks in Forest, VA. He has always dazzled me with his kicks, especially his jump kicks. What I will analyze now is one of his flying side kicks. A real-time video of his kick may be seen below.
Let's now look at some of the physics behind such a spectacular kick. The image below shows Mr Davis just as he has left the mat (click on the image for a larger view).
He ran from right to left and elevated off the mat at a speed of about 4.0 m/s (8.95 mph) and at an angle of approximately 46 degrees from the horizontal. His center of mass was about 1.9 m (6.2 ft) from the front of the target. Notice his arms are out. He will pull them in and rotate them while in the air so that he can get his hip to turn clockwise (as seen from above). That will ensure maximum power when it's time to kick.
Check out Mr Davis at the top of his trajectory (click on the image for a larger view).
This image is 0.28 s after Mr Davis left the mat in the first image. Note how his body has turned; you can see his back more clearly here than in the first image. Note also how his left arm is extended in a front punch while his right arm is tucked closer to his body. Further note how his legs are tucked in. What that does is store potential energy much like a compressed spring. While at the top of his trajectory, which had his center of mass 1.3 m (4.3 ft) off the mat and 0.42 m (1.4 ft) higher than at launch, Mr Davis had a center-of-mass speed of roughly 3.0 m/s (6.7 mph). With a weight of 750 N (169 lb), Mr Davis had a kinetic energy at the peak of his trajectory of about 329 J, which is almost the latent heat needed to melt a gram of ice. Think about that for a moment. A great karate athlete at the top of a flying side kick has as much kinetic energy as the energy needed to melt just a single gram of ice. That's quite a lot of energy needed for such a small amount of ice!
We now come to point of impact, shown below (click on the image for a larger view).
Just 0.12 s from his peak trajectory point in the previous image, Mr Davis made use of that stored energy in his tucked legs. By extending his kicking leg at the point of impact, he made his foot move faster than his center of mass. His foot entered the target's padding at a speed of 7.0 m/s (15.7 mph), more than 2.5 times his center-of-mass speed. The target weighs 1155 N (260 lb), 92% of which is contained in the black base. Mr Davis kicked the target 1.2 m (3.9 ft) above the mat with an average force during the first 1/30 s of nearly 1150 N (258.5 lb). That is essentially the weight of the target! He continued to drive his foot into the target as he fell and managed to overturn the target. The target's heavy base helps keep the target upright, unless a powerful flying side kick comes along!
Watch the video again. If you think it's easy to defend against a flying side kick, keep in mind that from launch off the mat to impact with the target took just 0.4 s. If you saw Mr Davis running before his launch, you would obviously have more time to get out of the way or prepare for some type of defense. If you were facing the opposite direction and only turned when you heard Mr Davis launch off the mat, that's another matter entirely. You will need exceptionally quick reflexes and fast mental processing to defend against that kick in a time of only 0.4 s.
As with most things that people do well, executing a flying side kick like Mr Davis requires years of training and practice. It's worth it because that's an amazing kick!
After seeing my beloved Vanderbilt Commodores fall behind Cal State Fullerton 3-0 after nearly six innings yesterday before rain suspended the game, I thought we were sure to lose today when the game resumed. Losing the first game in the College World Series puts a team on a tough track to win it all. But what's great about sports is the totally unexpected. We got a run to finish off the bottom of the sixth inning. We got to the bottom of the ninth down two runs. After a couple of doubles got us a run, Jeren Kendall came up with a man on second. On the second pitch he saw he hit a home run to right center, ending the game and giving Vandy the 4-3 win. The image below is the screen capture I took while watching the game (click on the image for a larger view).
How sweet it is! We continue the march to defend our title with TCU up next.
An incredibly busy academic year, followed by preparations for leaving the country for my upcoming sabbatical year, have cut my blog writing significantly. But a World Cup in the beautiful game is too enticing to stay away from writing. The 2015 FIFA Women's World Cup begins this Saturday (6 June) in Canada. FIFA isn't exactly anyone's favorite organization right now, and I doubt many people are sad to see Sepp Blatter leave his position as president of FIFA. I sympathize with the female athletes who will have to compete in Canada on artificial turf. It seems next to impossible to imagine male athletes being made to play their sport's biggest competition on artificial turf. Oh well, we have to accept what's coming and try to enjoy soccer played at its pinnacle in the women's game. For all the controversy associated with playing surfaces, I doubt there will be much controversy over the match ball. The Adidas Context15 is a textured ball that behaves much like the Brazuca used in last year's Men's World Cup in Brazil. My research colleagues at the University of Tsukuba in Japan, Takeshi Asai and Sungchan Hong, sent me wind-tunnel data for the new Context15. With their permission, I show a comparison of the drag coefficients for Brazuca and Context15 in the graph below (click on the image for a larger view).
Keep in mind that 10 m/s is the same as 36 kph and a bit more than 22 mph. The precipitous drop in the drag coefficient is the so-called "drag crisis," which is where the air flow around the ball changes from laminar to turbulent as the speed increases. The takeaway from the above plot is that Context15 should behave similar to Brazuca. Having the drag crises in roughly the same speed range is key to the comparison, as is the high-speed value of the drag coefficient.
A great month of soccer is coming. The day before the Women's World Cup ends will see this year's Tour de France begin. Two months of great sports ahead!
I wrote a blog post (click here) at the end of last year on Stephen Curry. Another news organization asked me to look at Curry again. That guy can flat-out shoot! He's got a great release with little wasted motion. What a joy to study! Click here for the latest article I contributed to on Curry's shooting.
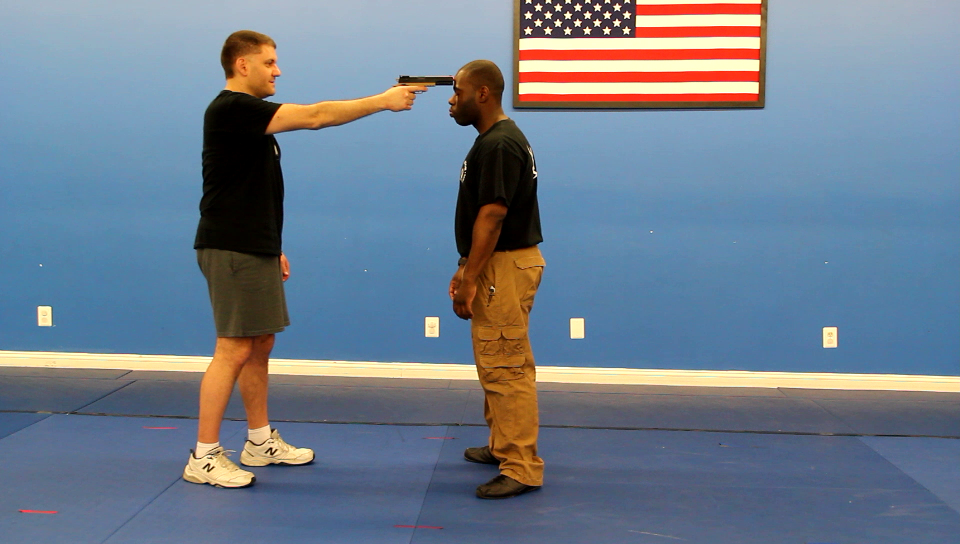
No, I'm not being figurative with my blog post's title's question. I mean it literally: what if someone has a gun pointing at your head? Check out the photo below (click on the image for a larger view).
What you see above is your humble blog writer pointing a practice handgun at the head of his karate and Krav Maga instructor, Clifton Abercrombie of Super Kicks (web, Facebook) in Forest, Virginia. My instructor is about to demonstrate a Krav Maga technique for defending oneself against an assailant who points a gun right at the head of a would-be crime victim. Krav Maga means "contact combat" in Hebrew and is an Israeli martial arts system that is essentially an amalgam of the best techniques from various other martial arts systems.
Does what you see above look a bit scary? I'm certainly not crazy about seeing a gun pointed at anyone's head. Using practice weapons in a safe environment, I train with several others in Krav Maga, and part of our training involves escaping the frightening situation mimicked in the photo above. I frankly have no idea how well I would do if ever unfortunate enough to find myself with a loaded gun pointed at my head. I hope that training will give me an automatic response so that I'll at least be able to fight back.
What I wish to focus on here is the physics behind what Mr Abercrombie is about to do next. His main goal is to get the gun's barrel out of line with his head -- and do it quickly! What about moving his entire body to the side? Too much mass! It will take too long. He will move his arms, which are much less massive than his whole body. The best athletes have been measured to have a reaction time of not less than about 0.2 s. During those measurements, however, athletes knew what was coming and how they were to react. For most us in a car, we have a reaction time of at least a full second. The study of human reaction time involves neurophysiology, biomechanics, and a host of other goodies. First the eye (or some other sense organ) detects something, then the brain processes a signal, and then the brain tells the body to do something. That's obviously highly simplistic, but if an attacker with a gun isn't expecting resistance, assuming the attacker's reaction time to be a full second isn't likely to be that far off. Note that I use reaction time to mean the time between Mr Abercrombie initiating his defense, which may be imperceptible to me if I'm staring at his face and perhaps yelling at him, to the time when I fire the gun in response to my brain finally processing that he is fighting back and getting a signal to my hand to fire.
Let's now turn to the defense. Check out the sequence of photos below (click on the image for a larger view).
It took Mr Abercrombie just 0.8 s from the first wiggle his hand made that showed he was initiating a defense to getting his hands on the gun, as shown on the left. If you think a reaction time of a full second is too large and that a safety factor is needed, cut that reaction time in half. I would not have distinguished his initial hand movements from normal motion. The first half of that 0.8 s probably passed before I even noticed that he was trying to defend himself. So if I'm able to react from that in half a second, he still has his hands on the gun before I can fire. The photo on the right shows that his head is out of the gun barrel's firing line. The time between left photo and right photo is just 0.03 s. Even if I can get a shot off, it will sail over his head.
Note in the very first photo above that I kept my finger off the trigger and along the side of the gun. While practicing, that's very important! Watch what happens next (click on the image for a larger view).
Mr Abercrombie rotated my hand and gun clockwise (as seen by him) and away from him toward his right. He kept rotating such that if my finger were on the trigger, he would have used enough torque to have broken it! That's part of the technique. Distract the assailant with something to think about (like pain from a broken finger!) while the tables get turned. I am officially disarmed in the photo on the left, and that took Mr Abercrombie just 0.16 s after he had the gun's barrel clear of his head. The image on the right is 0.1 s after the left image. Note that Mr Abercrombie not only has control of the gun with the barrel pointed away from him and toward me, he still maintains control of my hand. That's important because a real attacker is likely to be fighting back at this point.
Now we get to the end and I, as the dumbfounded faux attacker, have realized that I messed with the wrong man! Click on the image below for a larger view.
Just 0.16 s after the previous image, Mr Abercrombie released my hand. He then cleared away and secured the gun to his side. I'm left with an open hand! The entire technique from the first image I showed above with Mr Abercrombie beginning to move his hands to the final image on the right took just under 2 s. That was all the time needed for my Krav Maga instructor to react to having a gun at his head to holding the gun himself while at a safe distance from me. Not bad, huh?
To see the technique play out in real time, check out the movie below.
There are a couple of seconds of set up time, followed by the disarming technique in action. Mr Abercrombie makes it look simple, but a LOT of training is required to be that good!
Today marks 206 years since the birth of Charles Darwin, which means another Darwin Day is upon us. I will never cease to be amazed by what Darwin did for science in particular and humanity in general. Painstaking and meticulous work led to a profound revolution of thought. That Darwin was able to reach the conclusions he did well before the discovery of DNA and without the hundreds of thousands of fossilized species occupying the world's museums today simply staggers my mind. Given that DNA evidence and the fossil record have verified Darwin's seminal ideas, having a Darwin Day is more than appropriate. Celebrate Charles Darwin today. Check out the Darwin Day website here. Celebrate science, too. For it's insatiable curiosity about the natural world that propels scientists to great discoveries.